Predictive maintenance and EAM strategies – Strive for progress, not perfection.

Author Iva Danilovic | Copperberg

Implementing the right maintenance and EAM strategy is crucial for successful asset management. However, every company has its own maintenance maturity path. Wherever your company might be at this moment, the journey from reactive to proactive maintenance can start continually, and be improved at every step.
Copperberg invited the experts Stevie Hay, Aptean Group Vice President and Johan Berglund, OEE & EAM lead for Moelven Digital Transformation project, to discuss how to future proof maintenance operations, follow the latest EAM trends and stay relevant for the long term.
It doesn’t matter where you are in the maintenance journey you can always find areas of improvement. As Stevie Hay, Aptean Group Vice President for multiple industry-specific EAM and manufacturing software solutions says, implementing software along with changing business practices can lead to as much as 75% impact on profitability.
Mr. Hay has gained plenty of experience working for Aptean. The leading global provider of mission-critical, industry-specific enterprise software solutions assists over 4,100 organizations in more than 20 industries across 54 countries with running their operation. All these companies are witnessing the pressures of digital transformation and new technologies. “Rest assured you’re not alone”, says Aptean Vice President, and suggests that the solution lies in finding the right strategy.
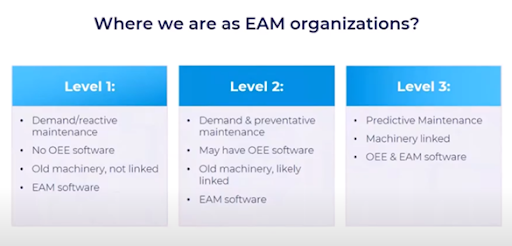
“First of all, we need to find where we are in our maintenance journey, what opportunities are there for improvement”, he explains. One of the tools that can help the companies to find out where they stand in terms of maintenance maturity is the evolution of the maintenance chart. The chart shows how companies can change their maintenance approach and improve efficiencies.
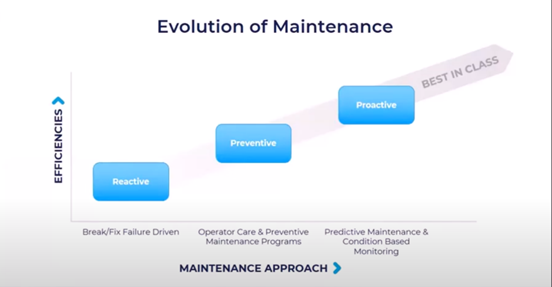
Going from the left, on the first level, there are companies that create work orders based on the events on the manufacturing floor. This failure-driven maintenance operation is followed by the level. At this stage, companies reach a preventative maintenance level while using EAM software that is linked to at least one machine.
The companies that reach level 3 use both OEE and EAM software, and have several pieces of equipment that are linked and emit signals. Instead of replacing functioning parts, this enables condition-based monitoring, data collection, business intelligence adoption, and overall proactive, predictive maintenance.
The evolution of maintenance goes hand in hand with the advanced use of EAM software, which helps the companies to better manage the resources. If our enterprise is facing frequent unplanned downtime, and it doesn’t have good visibility into trends in failures or root causes, then it is the right time to ask ourselves how much do we really know our equipment? Mr. Hay notes.
The asset transparency of a company has been usually improved following the preventive maintenance timeline. New EAM & OEE trends bring many more possibilities that are easy and fast to implement. That being said, the path towards establishing digital maintenance processes shouldn’t take too long. The typical implementation of software takes a few weeks rather than months.
The effects of the implementation include minimizing equipment downtime and maximizing the reliability based on the data-driven insights of connected assets. The mutual integration of the machines and OEE and EAM software is the key to a successful maintenance maturity journey. That proactive, predictive maintenance, condition-based maintenance, monitoring the machines is really helping us make the decisions. “That’s the growth path that we’re all really wanting to go on”, concludes the Aptean Vice President.
Still, an interesting PwC study showed that the majority of companies haven’t reached the predictive maintenance level.
Similarly to Aptean, in its study, PwC covers a range of levels. It is interesting to see that 70% of companies that were part of this research were spread from ground level, where there are visual inspections and no PdM, to level two where the instrument inspections are established.
Only about 30% of companies on the market have made progress beyond the manual mode.
About 20% of them have reached level 3, which is based on real-time condition monitoring, while there were only 11% of companies that were identified as doing actual predictive techniques.
PwC study on the predictive maintenance trends
It looks like that many companies are still not sure how to utilize emerging technologies. To start with, Mr. Hay thinks that companies should understand the real purpose of AI:
“Everybody still talks about AI, but it is still being used for reporting. The reports are just a list of data, it’s like a snapshot in time, and it is really meant for something else. It’s a tool to help companies to make business decisions.”
AI helps organizations get through complex data and find the patterns quicker. It could take years for a person to do the same job, so the point of AI is to speed up these processes. Unlike the readings of big chunks of data done by humans, AI prefers going through extensive data lines. “The more data you sample the easier it will be for your AI to recognize a pattern”, Johan Berglund, OEE & EAM lead for Moelven Digital Transformation project agrees.
Nonetheless, human interaction is still needed to understand the data, this is why EAM & OEE allows employees across departments to see the relevant information. It is not just the top managers who get to access the data, the end-users also get the ability to do the analysis. The tools are also available to site managers, crew managers, and engineers on the floor. They are able to provide their own special feedback so the management is able to make better decisions in guiding the maintenance department.
Stevie Hay remembers an Aptean customer in North America who had moved to level 2 in their process and experienced a reduction of reactive work orders, which went from 85% to 20%. They completed 25% of work with 75% fewer resources and they reduced their consumable costs by 50%. Finally, the improvements that go along with the maintenance maturity journey are visible through analysis of savings in operational efficiency, maintenance labor and MRO inventory, as shown in the table below.
Benefits – Industry Results
| Area | Influence | Improvements |
|
Operational |
Maintenance Efficiency | Up 20% |
| Production Capacity | Up 5% | |
| Production Downtime | Down 10% | |
| Energy Consumption | Down 10% | |
|
Maintenance |
Maintenance Labor Costs | Down 10% |
| Productivity | Up 10% | |
| Overtime | Down 10% – 20% | |
| Contractor Costs | Down 25% – 30% | |
|
MRO |
Inventory & Maintenance Storeroom Costs |
Down 20% |
| Maintenance Material Costs |
Down 10% |
Data provided by A.T. Kearney, Pulsemark Benchmark, ARC Advisory, US Dept. Of Energy, Gartner Group, Grant Thornton, PriceWaterhouseCoopers, Tompkins Assoc., Lifecycle Engineering Study. Presented by S. Hay, Aptean