Industrial manufacturers are under mounting pressure to cut carbon emissions, reduce hazardous substances, and future-proof their portfolios against regulation and shifting customer expectations. Yet in many boardrooms, sustainability is still treated as a compliance requirement or a cost to be minimised rather than a lever for value creation.
Author Copperberg Editorial Team | *This article was developed using a combination of human expertise and AI-assisted writing. The concept, structure, and editorial direction were defined by our team, while elements of the text were generated with the support of advanced language tools. All content has been reviewed, refined, and approved by humans to ensure accuracy, clarity, and relevance.

Photo: Magnific
At Sustainability in Service 2025 – Power of 50, Johan Lunabba of Ahlstrom explained how the company systematically assesses the sustainability performance of its 6,000-product portfolio and links it to key financial metrics, such as EBITDA, margins, and growth, showing that more sustainable products are not only viable, but they can also be more profitable and grow faster than the rest of the portfolio.
The transformation, accelerated under private equity ownership, rests on three pillars:
- Treating sustainability as a product design and portfolio strategy issue, not a marketing layer.
- Using a robust, externally aligned framework (Safe and Sustainable by Design) to measure performance.
- Making portfolio and pricing decisions based on data, even when it requires sunsetting profitable bad actors.
Sustainability is no longer just about doing the right thing. Done properly, it is a disciplined way to concentrate capital, innovation, and commercial effort on the most attractive parts of the business.
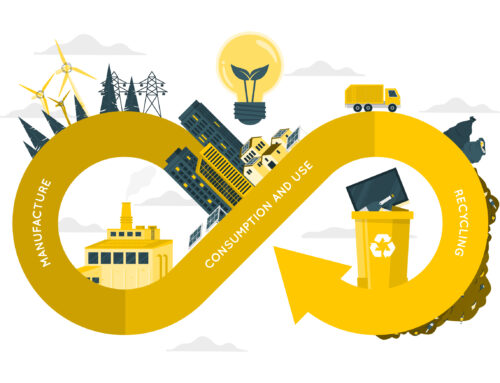
From Niche Materials to a Portfolio-Level Sustainability Strategy
Ahlstrom’s model is built around a highly specialised, fragmented portfolio serving applications such as filtration, medical, construction, and packaging, competing in focused niches where technical differentiation matters.
Across this portfolio, customer expectations consistently align around three priorities:
- Technical performance: High-performing, advanced materials;
- Value for money: Strong price-performance, backed by innovation and service;
- Sustainability: Lower carbon footprint, safer materials, and improved end-of-life outcomes.
Customers are not willing to trade one dimension for another. They do not want sustainability at any cost, nor performance without regard for environmental impact. The competitive advantage lies in optimising all three simultaneously.
Achieving this requires a systematic way to measure and compare sustainability performance across a large and diverse product portfolio, making it a core input into product, portfolio, and commercial decisions rather than a standalone consideration.
Safe and Sustainable by Design: Turning a Policy Concept Into a Business Tool
To operationalise this, the organisation adopted the European Commission’s Safe and Sustainable by Design (SSbD) concept as a core product and portfolio management tool.
The approach breaks sustainability into two measurable dimensions:
- Safe by design, product safety, with a primary focus on chemicals:
- What chemicals are used in products and operations?
- Are they hazardous or of concern?
- How do they interact, and what residues are present in the final product?
Each product or product family is scored on a scale of 1 to 5, where 1 indicates the presence of problematic substances and 5 indicates strong performance against safety criteria. Some chemistries are simply unacceptable in a safe-by-design context.
- Sustainable by design, relative environmental performance:
- How does the product’s carbon footprint compare to a reference or competing solution?
- What does the end-of-life scenario look like (recyclability, biodegradability, landfill impact, etc.)?
Again, scored from 1 to 5, this dimension is comparative. A 5 indicates outperformance versus market references, while a 1 signals poor environmental performance.
The two scores are then averaged. Any product scoring above 3.5 qualifies as SSbD, according to the EU guidance. Products scoring in the middle are not necessarily bad, but do not deliver a sustainability-driven differentiation versus alternatives in the market.
This framework is applied across the entire portfolio, and performance is measured in financial terms.
Seeing the Portfolio Clearly: Mapping 6,000 Products
When the company first mapped all its products against the SSbD score, several key patterns emerged:
- Around 35% of products initially scored 4 or 5, strong sustainability performance, often clearly outpacing comparable products on the market.
- A large cluster sat in the middle, products broadly similar to competing solutions from a sustainability point of view.
- A smaller but significant group performed very poorly, featuring hazardous chemicals, poor end-of-life outcomes, or both.
To turn insights into action, the portfolio was segmented into three zones:
- High sustainability performers (scores 4–5): The business to grow aggressively.
- Mid-range performers: The main target for R&D and innovation, where substituting hazardous chemicals or reducing carbon footprint can move products up.
- Poor performers: Products under scrutiny. If they cannot be improved within a reasonable timeframe, they are candidates for managed exit, even if they are profitable today.
The classification itself is not distinct, but the willingness to treat the first category as the strategic growth engine and the last category as a genuine exit pipeline, guided by financial data rather than rhetoric.
The Hard Link: Sustainability Scores and Profitability
SSbD scores were plotted against financial metrics at product level. Using 2021 as a baseline, two correlations were examined:
- Sustainability score vs. EBITDA margin.
- Sustainability score vs. margin over variable cost.
In both cases, the higher the sustainability score, the better the margins.
Statistically, around 45% of the variation in EBITDA margin across products could be explained by sustainability performance. For margin over variable cost, the explanatory power was roughly 50%.
This was not a niche effect. Across the portfolio, products that were environmentally friendly also tended to be better for the P&L.
- Growth rates differed. Products classified as SSbD exhibited double-digit growth rates, while less sustainable products grew only in the single-digit range.
- The commercial organisation’s perception did not match the data. Sales teams frequently argued that customers were unwilling to pay for sustainability. When pricing and margin data were analysed, it became clear that customers were, in fact, paying more, albeit within modest limits.
Once the data was made visible and robustly analysed, questions about whether sustainability paid off largely disappeared. The conversation moved on to how fast the portfolio could be shifted toward high sustainability.
Pricing Reality: Modest Premiums, Big Impact at Scale
The analysis of pricing dynamics provides a more grounded view of the green premium:
- Limited willingness to pay: Customers typically accept only a modest uplift, around 5% at most, linked purely to sustainability attributes. Anything significantly higher is difficult to sustain in the market.
- Realistic premiums are smaller, but meaningful: In practice, premiums tend to fall in the 2–3% range. While modest at product level, they become significant at portfolio scale.
- Shift to value-based pricing: Cost-plus models are not effective for sustainable products. Pricing needs to reflect the broader value delivered and make that value explicit to customers.
Even relatively small premiums can translate into meaningful financial impact when applied across a large portfolio, particularly when combined with stronger margins and faster growth.
Importantly, the assumption that more sustainable inputs always come at a higher cost does not consistently hold. In some cases, alternative materials or chemistries are actually cheaper than legacy options, meaning that margin improvements can be driven by both pricing and cost optimisation.
Customer Demand: Many Drivers, One Direction
Why are customers choosing safer and more sustainable products and, in many cases, accepting a modest premium?
The drivers, as observed, are diverse:
- Regulatory compliance and future-proofing, especially in sectors more exposed to chemical regulation or product-specific rules.
- Corporate climate and sustainability commitments, for example, Science-Based Targets (SBTi) requiring lower embedded emissions in purchased materials.
- Brand and market positioning, differentiation to downstream customers and end-users.
- Risk management, reducing exposure to substances that may be restricted or banned in future.
No single, uniform motive dominates across all customers or segments. Instead, there is a basket of reasons, varying by sector and application. This places responsibility on suppliers to offer technically compliant, cost-competitive, and sustainability-enhanced solutions, and to help customers understand the combined value.
What seems consistent, however, is the ceiling on willingness to pay. Sustainability can justify a modest premium and secure preference, but only when technical specifications and cost expectations are also met.
Sunsetting Bad Products: Private Equity Discipline Meets Sustainability
One of the most difficult aspects is managing products that are still profitable but perform poorly on sustainability metrics.
Once the data makes the trade-offs clear, showing that more sustainable products deliver stronger margins and growth, the action case becomes harder to ignore. This often leads to a more disciplined, portfolio-driven approach.
In practice, phasing out underperforming products follows a structured process:
- Identify underperformers: Products with weak sustainability and safety scores are flagged as long-term risks.
- Quantify the impact: The revenue exposure is clearly defined, along with a realistic timeline for action.
- Define replacement pathways: The business must replace the revenue, either by improving existing products or shifting focus to higher-performing alternatives.
- Escalate and commit: Decisions are taken at the appropriate leadership level to ensure alignment and follow-through.
In some cases, no immediate substitute exists, requiring a temporary acceptance of revenue loss. In others, especially in regulated environments, transition timelines may extend over several years to allow for reformulation and approval of new solutions.
If a product cannot be improved within a reasonable timeframe and falls short on sustainability and safety, it does not fit the long-term portfolio, regardless of its current profitability. Capital, capacity, and talent are better directed toward more future-proof opportunities.
Aligning Incentives: Making Sustainability a P&L Responsibility
To move beyond isolated initiatives, sustainability performance is directly linked to incentives and tracked at portfolio level.
The share of sales from SSbD products is embedded in long-term management incentives, while hundreds of employees have sustainability-related targets as part of their short-term performance metrics.
Progress is measured through the share of total sales coming from SSbD products:
- Approximately 45% at the starting point;
- Around 66% currently, representing a substantial portion of total revenue;
- A target of at least 80% by 2030.
Reaching the current level has been driven by two main levers:
- Operational improvements: Significant investment in decarbonising production and reducing the footprint of existing products.
- Product reformulation: Gradual replacement of hazardous or problematic materials with safer alternatives.
Most of the easier gains have already been captured, and further progress will depend on deeper innovation, more fundamental product redesign, and potentially new business models such as circular or service-based approaches.
Lessons for Industrial Leaders: Data, Focus, and Calculated Risk
Ahlstrom’s journey yields valuable insights for industrial and aftermarket leaders seeking to align sustainability and profitability.
- Data is the foundation of credibility, internally and externally.
Opinions about sustainability abound. What changes decision-making is not rhetoric but robust, product-level data connecting sustainability performance to margins and growth. Once correlations became visible, resistance weakens.
- Frameworks matter, but only when operationalised.
SSbD is an EU concept that many treat as regulatory guidance. Turning it into a scoring system, portfolio map, and commercial steering mechanism is what creates business impact.
- Focus the organisation on the right categories.
Explicitly designating high-sustainability, high-margin products as the growth engine, assigning R&D to move mid-range products up, and treating poor performers as an exit pipeline clarifies priorities and reduces distraction. Poor products consume bandwidth and asset time. Systematically phasing them out liberates both.
- The green premium is real, but modest. Scale makes it powerful.
Most B2B customers will not accept double-digit sustainability premiums, but 2–5% is a realistic band. At portfolio scale, even a 2% uplift is strategically meaningful, especially when combined with lower costs and faster growth.
- Cost assumptions need to be challenged.
Not all sustainable ingredients or materials are more expensive. In some cases, more sustainable options are cost-competitive or cheaper. Without challenging legacy assumptions through sourcing and formulation work, these opportunities remain hidden.
- Ownership and governance can accelerate difficult decisions.
Private equity-style governance, with a strong focus on value creation and evidence-based decision-making, can enable bolder moves, including sunsetting profitable but unsustainable products. However, the underlying logic is transferable to any ownership model willing to act on data.
- Incentives must reflect strategy.
Embedding sustainability-linked sales shares into both long-term and short-term incentives helps ensure that sustainability is treated as a core business driver, not a side project of a small sustainability team.
Towards a More Profitable, Sustainable Industrial Base
For many industrial and aftermarket organisations, the question is no longer whether sustainability matters, but how to make it commercially viable and scalable.
- Start from customer value, not abstract concepts.
- Use a rigorous, externally aligned framework to quantify sustainability at product level.
- Link sustainability metrics to financials and incentives.
- Be prepared to make uncomfortable decisions about profitable products that perform poorly on safety and sustainability.
- Invest deliberately in decarbonisation, safer chemistries, and product innovation targeted at the most attractive parts of the portfolio.
Sustainability, when integrated into product strategy and portfolio management, is not a trade-off against profitability. On the contrary, it can be a powerful lens for focusing resources on higher-margin, faster-growing, and more resilient businesses.
In a market increasingly shaped by regulation, customer climate commitments, and supply chain scrutiny, companies that master this integration will not only comply, but they will outperform.
About Copperberg AB
Founded in 2009, Copperberg AB is a European leader in industrial thought leadership, creating platforms where manufacturers and service leaders share best practices, insights, and strategies for transformation. With a strong focus on servitization, customer value, sustainability, and business innovation across mainly aftermarket, field service, spare parts, pricing, and B2B e-commerce, Copperberg delivers research, executive events, and digital content that inspire action and measurable business impact.
Copperberg engages a community reach of 50,000+ executives across the European service, aftermarket, and manufacturing ecosystem — making it the most influential industrial leadership network in the region.